In the DMT documentation on the Interpreting Results page, I have a section called Deep Ancestors. It says:
If the Triangulated Group is from a common ancestor, then there may be smaller identifiable groups within it that are either from a later crossover down one descendant line (in which case all the people having that crossover are in that line) or are from an ancestor of the common ancestor. In the latter case. everyone with the segment to the left or the segment to the right can be placed into a deeper ancestor Triangulation Group. Some research will be needed on how exactly to determine and do this and it may be possible one day for DMT to identify these for you.
David Boyles on the DNA Tools Facebook group asked me to explain this more fully and I thought that was a good idea.
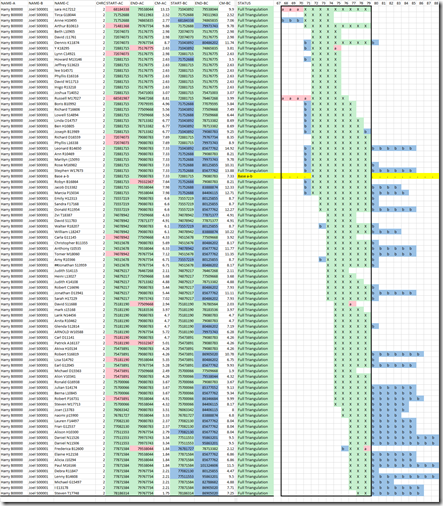
The example diagram used in the documentation may not have been the best one to explain this concept because it didn’t have easily identifiable crossovers in it. So here’s a new example of DMT output taken from the DMT sample files.
(Click on the image to expand it)
In the graphic area in green, you’ll find one triangulation group outlined by the box. This group is made up of all 87 of the people who triangulate with both Harry B (Person A) and Joel S (person B). The match between the two of them is shown by green X’s on the yellow line between base addresses 72,881,715 and 79,080,783 on chromosome 2.
For the other 87 people, e.g. on the first line, Sara m is person C, the green X’s shows the double match where Person A matches Person C and where Person B matches Person C. Since this double match segment overlaps with the match between Person A and Person B, we have all three sides of the triangle and we have a triangulation.
The red a’s are where Person A matches Person C but Person B doesn’t. The blue b’s are where Person B matches Person C but Person A doesn’t.
You’ll notice the lower and upper bounds of the triangulation group contains all the X’s and all the a’s but not all the b’s. That’s because we are looking from Person A’s point of view. A single match of Person A with someone in the triangulation group is likely to have also come from the same common ancestor. This is likely also true for Person B’s. But Person A doesn’t share that match. Person A has a crossover that Person B didn’t get, thus the triangulation group for Person A ends while Person B’s doesn’t. If you want Person B’s triangulation groups, then run Person B as Person A. You’ll find the groups will be different because every person’s chromosomes map to their own ancestors.
Deep Ancestors
Now for the fun part. Look at the green X’s in the diagram. They are all in the Triangulation Group. That means there should be a Most Recent Common Ancestor (MRCA) for all of people in the group (if not by chance or different parental chromosomes). You’ll see the green X’s shift from the left to the right of the segment. Only about 10 of the matches in the middle of the diagram overlap with the majority of the Person A match with Person B. All the people are descended from a MRCA.
What about the shorter segments. Generally, a shorter segment means a more distant common ancestor and a larger segment means a closer common ancestor. Of course a crossover can happen anywhere, so there can be exceptions both ways with a small segment from a close common ancestor and a large segment from a distant one. But we are talking here about the matches within a triangulation group. They all have an MRCA and that forms the basis of the longest triangulating segments in the group.
So let’s consider our MRCA. Say she’s our gggg grandmother and she passed down that segment from 68,184,338 to 79,767,734 to Person A and the segment from 72,881,715 to 79,080,783 to Person B. What can we say about her?
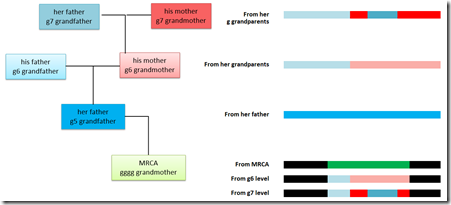
So lets say her father gave her that entire segment. Going back farther, her father’s segment is a combination of his parents, her paternal grandparents’ segments. They may or may not have crossed over right in the middle of this segment. Whether or not they crossed over, any of their ancestors that the segment came from may have crossed over somewhere on this segment. Here’s a 3 generation example:
The segment from the MRCA is in green. She got her entire segment from her father, but that came in pieces from her grandparents, which are subdivided further from her great grandparents. That subdivision can of course continue on to deeper and deeper ancestors.
Each generational level may subdivide the triangulated people. There will be people who are descendants of the MRCA and her father whose triangulating segment could span the entire triangulation group (or could be truncated by a crossover on their side from the MRCA).
And then there will be people who will be descendants of the g6 grandfather or g6 grandmother. Their segment will not overlap with each other but will fill a smaller portion – their own area of the triangulation group. And (very important) they will not be related to each other (unless they are related some other way).
Same goes for the g7 generation and further back. We are identifying the descendants of deep ancestors, deeper than our MRCA.
So then, how do we identify these people? What you have to do is look for the deep crossovers. Generally you can find them by identifying a common triangulation endpoint of a number of people that is just before a common triangulation startpoint of a number of people. The people to the left of the common endpoint could be from one deep ancestor. The people to the right could be from that deep ancestor’s partner, i.e. the other parent of the descendants they share.
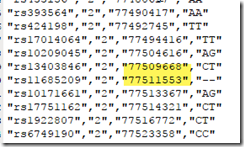
For example, in the example diagram at the top, we can find 4 people whose triangulating segments end at 77,509,668 and 3 people whose triangulating segments start at 77,511,553. Putting these people together, we get:
Base addresses less than a few thousand apart are generally next to each other in the raw data file. We can check and see that in fact, 77,509,668 is followed in the raw data file by 77,511,553. The base pairs in-between are not included in the raw data.
There are about 3 billion base pairs (aka SNPs), but only 700,000 of them are determined in a DNA test and those are what are included in the raw data file. Therefore, each base pair included is only about 1 in 4000, and that is why the base address jumps from a few hundred to a few thousand between lines in the raw data file.
Those 4 people ending at 77,509,668 are therefore all likely descended from an ancestor of our MRCA. And the 3 people starting at 77,551,553 are all likely descended from the partner (other parent) of that ancestor of our MRCA. Note they are still all descendants of our MRCA. But the fact that their segments end and then start at a crossover gives us more information. Once the MRCA is determined, we might be able to piece together the family trees of the 7 people, to help us go back a few more generations from the MRCA. Doing this will help find deeper ancestors than the MRCA.
The above example actually has 6 other sets of people with some stopping at some base address and the rest starting at the address of the next base pair.
There are a whole number of caveats with this process. Again, some triangulations may be by chance. Some segments may be extended with a random bit that prevents the end or start point from aligning properly. Some of the people may have a crossover that occurred down from the MRCA that happens to fall in the right place. But the toughest problem is that the genealogical evidence often will not go back far enough to determine who the deeper ancestors are.
None the less, this is how earlier ancestor’s crossovers manifest themselves in the match data. You should be aware of how this works as it will give you a way to subdivide triangulation groups into smaller components that will represent more distant ancestors.
And hopefully I can figure out a way to program all this into Double Match Triangulator for you.


Joined: Thu, 12 Jan 2017
14 blog comments, 0 forum posts
Posted: Mon, 2 Oct 2017
Determining crossover points is a key factor when developing a Visual Phasing chromosome map of each chromosome for a given group of ancestors. Determining earlier sub-groups is certainly an important additional capability. Now that DMT can be used for GedMatch results as well as FTDNA, DMT can provide the basis for determining all of the crossover points in a given set of matches for a person’s chromosomes. I use both DMT and Steven Fox’s Visual Programming spreadsheet, so this information is clearly valuable to me. Presently I will have to have both programs open and then manually work with the data in DMT to assign crossover points in VP. It would be Paradise Found if there was an automated way to have the DMT crossover points automatically available to, or transferred to a VP spreadsheet. Further, in VP we use cousins and matching strangers to confirm, or in some cases to identify segments as belonging to each of the four grandparents. Such segments are normally only a part of the total mapped segment, and I suspect correlate to DMT’s assigning shorter segments to ancestors of the MRCA. This data could make it possible to actually provide VP partial segment identifications within the fully mapped segment. If automatic coordination between the two programs becomes reality, it will represent a huge leap forward in our ability to make full use of autosomal DNA matching.
Joined: Sun, 9 Mar 2003
291 blog comments, 245 forum posts
Posted: Tue, 3 Oct 2017
Joe: I’m hoping to come up with a method of chromosome mapping using the match information and then display the map in the DMT output. If that is successful, then it will be an automated system that does what visual phasing does plus more (sometimes going back to generations further than grandparents). I think the chromosome map is quite doable, but I don’t know yet if the paternal/maternal sides can be assuredly assigned. I’ll have to play with the X chromosome a bit more because I think that is the key to determining the parent.
Joined: Thu, 12 Jan 2017
14 blog comments, 0 forum posts
Posted: Tue, 3 Oct 2017
With all due respect, Steven Fox’s VP spreadsheet works wonderfully, once the crossover points are correctly identified. Have you worked with it yet? As I said, your work can take the cousin matches back further than just the 4 grandparents, so some type of correlation between the two programs is definitely in order. I’m really interested in what you are doing, so I remain excited.
Joined: Sun, 9 Mar 2003
291 blog comments, 245 forum posts
Posted: Wed, 4 Oct 2017
Joe,
Sorry to take so long to respond. I hadn’t seen Steven Fox’s spreadsheet before. Couldn’t find him or mention of his tool on Google. Finally, I discovered he was part of the Visual Phasing Facebook group. So I requested membership, and Blaine Bettinger, the group coordinator approved me. So finally I was able to search out Steven and his spreadsheet.
Yes, I agree visual phasing can drive a sane man crazy. Steven has done an amazing job to develop that spreadsheet. I don’t have enough close relatives to do visual phasing, so no, I haven’t attempted it yet. But I understand the process, as good as someone who hasn’t actually done it, can understand it.
Sorry, but for the immediate future you’ll have to continue getting crossover points from DMT into Steven’s tool. My priority has to be to see if I can somehow figure a way to get DMT to map the triangulated matches onto some sort of ancestral tree for you… so that you won’t have to do that manually yourself.