Visual Phasing is a technique to assign DNA segments of 3 siblings to their four grandparents. I don’t happen to have 3 siblings who all tested their DNA, so up to now, I’ve never had a personal use for the technique.
A few months ago for a DNA study we are doing, my wife’s 3rd cousin Terry was kind enough to provide me with GEDmatch diagrams of himself and his two siblings on each chromosome. This allowed me to visually phase Terry’s grandparents to his and his siblings’ chromosomes.
Doing Visual Phasing on Terry’s with his Siblings
I will not try to teach you everything about Visual Phasing. It is quite involved and there are many good explanations of it. (e.g. Blaine Bettinger 2016). But I will point out anything that is relevant to the problem at hand.
This is what the GEDmatch diagrams look like for Chromosome 1:
(Click image for larger version)
So there are 3 comparisons. One for of each pair of siblings.
The yellow areas are matches between the two siblings known as HIR (Half Identical Regions). That’s where they match on one parent but not the other.
The green areas are matches between the two siblings known as FIR (Fully Identical Regions). That’s where they match on both parents.
The red areas are where they don’t match on either parent.
This particular set of comparisons, unlike some Visual Phasing cases, is very simple to solve. This seems to have very clear region boundaries.
The trick is to find recombination points. These should be where two of the three comparisons change their match status, i.e. color. I’ve added to the diagram vertical lines to show the recombination points.
Under the line is Mbp (Mega byte pair) position of the recombination along with the first letter of the “owner” of the recombination, i.e. the sibling who recombined at that point on either his/her father or mother’s chromosome. The owner is the person listed in both of the pairs having match status changes.
Using Visual Phasing rules, I can now assign two grandparents: f1 and m1 to one of Terry’s segments in the middle of the chromosome and extend it to Terry’s recombination points. Then I can use the pair matches and logic to see what the segments for Terry’s siblings need to be: f1, f2, m1 or m2. I extend those and repeat. In this case, I am lucky and I can completely fill out both chromosomes for all 3 siblings which isn’t always the case. This is what I got:
Filling Out the Parent Maps
Next was to determine which grandparent the f1, f2, m1 and m2 represents.
For this we need 2nd cousins who will have a set of great grandparents as their common ancestor with the siblings. A second cousin is connected through just one grandparent, so their matches should be able to be used to determine who each grandparent is.
Terry has five 2nd cousins tested on his father’s father’s side (ff) and two 2nd cousins tested on his mother’s father’s side (mf). He doesn’t have any tested on either his father’s mother’s side or his mother’s mother’s side, but that doesn’t matter.
These are the matches each of the siblings have with these 2nd cousins that are 15 cM or more:
In total, the 3 siblings match on 10 segments with their 2nd cousins.
The matches with the cousins that are on the sibling’s father’s father’s side are all denoted as f1 in the earlier map, so f1 = father’s father and f2 = father’s mother.
The matches with the cousins that are on the sibling’s mother’s father’s side are all denoted as m1 in the earlier map, so m1 = mother’s father and m2 = mother’s mother.
So we can now go back and color the chromosomes:
- ff (father’s father) in blue,
- fm (father’s mother) in green
- mf (mother’s father) in pink
- mm (mother’s mother) in yellow
Ta Da!! We’ve done it.
Is this accurate? Well I would say it would have to be. It uses recombination logic that is checked against 2nd cousin segments and is consistent with itself. The GEDmatch diagrams, which show if each SNP position matches zero, one or both of the other sibling’s alleles, seem to be quite definitive.
Boundaries Are Not Exact
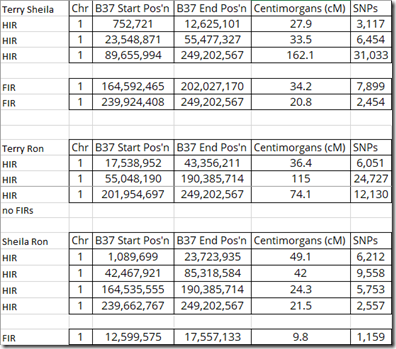
GEDmatch provides addresses of where these segments start and end:
If you compare the end positions that should coincide with the start positions, you’ll get:
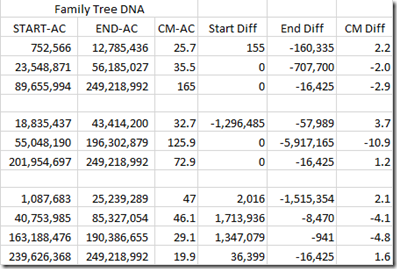
And they’re not the same between companies either. The HIR matches shown above at Family Tree DNA are:
That’s as much as a 10.9 cM difference between what GEDmatch and Family Tree DNA’s matching algorithms produce as matches.
My example is a relatively well-behaved example. Sometimes the HIR and FIR boundaries that GEDmatch produces don’t all visually correspond to the yellow, green and red regions it displays. That’s because GEDmatch’s matching algorithm sometimes adds a new boundary where you don’t see one, or excludes a boundary where you think one should be.
For example, GEDmatch does not list the FIR between 85 and 89 that is clearly a green section in the diagram. Leaving out the FIR would prevent proper analysis of this chromosome. The HIRs starting and ending at 85 and 89 would then have to be considered to be a single recombination and the ensuing analysis would be done wrong.
So Can Visual Phasing Be Programmed?
I have really wanted to find a way to do this via a program. There is a lot of manual work to get the final grandparent map. And it’s not a foolproof procedure.
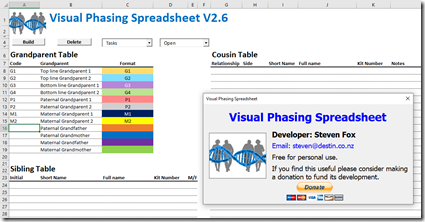
The Visual Phasing Working Group on Facebook hosts in its Files section, the Visual Phasing Spreadsheet by Steven Fox. Just a few months ago, Steven uploaded Version 2.6 of his spreadsheet along with an updated user guide.
Basically, the spreadsheet allows you to do what I did above, and gives you assistance along the way. But you still have to visually select the boundaries between the yellow, green and red regions and assign the grandparents,
Steven himself in his user guide states:
Things I would love to be able to do but can’t think of a way to do them…… yet.
• Obtain the location and identify the owner of the
recombination points automatically.
• Find a programmatic way to phase automatically!
If the GEDmatch segment boundary points were exact and always corresponded to the visual color boundaries, then maybe they could be used. But unfortunately they are not and don’t.
Determining the boundaries visually from the yellow, green and red regions is a perfect problem for a human, who sees patterns easily and can round off boundaries. Computers don’t do that nearly as well as humans do.
And then there’s the resolving of unclear circumstances, e.g. where sections are partly yellow and green, or apparent recombination points that only seem to change one pair rather than the two. And what always messes up any Visual Phasing is when two of the siblings have a recombination point very near each other. What if the parents of the siblings are related? The list goes on.
I have thought about possible ideas for programming Visual Phasing, but as of yet, I still have not come up with a decent way to program the whole thing. Yes of course it is possible, but it’s not worth anything unless it could get at least as good results as a person can.
Visual Phasing has been a technique that’s been around since the mid 2010s. If there would have been an easy way to program this accurately, then one of the many very smart 3rd party DNA tool developers would have done so by now.


