Ancestry has recently made changes to its display of the amount of DNA you match with someone. The amount is shown in cM (centimorgans). Most DNA testers using their DNA for genealogy purposes know what cM are and what they represent.
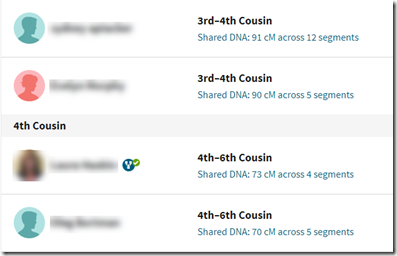
Your DNA match list shows the Shared DNA you have with each of your matches.
The change Ancestry made that I’d like to talk about is the addition of “Unweighted shared DNA”. When you click on the “Shared DNA” link, you’ll be shown information containing this unweighted segment value:
Here you’ll see a “Shared DNA” value of 91 cM and an “Unweighted shared DNA’” value also of 91 cM. When the shared DNA value is 90 cM or more, the unshared value is always the same.
But when the shared DNA value is less than 90 cM, then the unweighted value can be more, and usually is. The unweighted value can be as high as 89 cM.
Ancestry uses what they call their Timber algorithm to filter out pieces of DNA that it figures should not be considered when deciding if two people are related.
A lot of people, including myself, have been critical of Timber believing it removes segments that it shouldn’t and they were very happy with the new information that now shows the pre-Timber amount. You can’t easily get this amount for all your matches. You do have to click through each match one by one to get that match’s unweighted value. You cannot see them all on your DNA Matches page like you can the post-Timber values.
Comparing Average Shared Values
The research work I’m currently doing on one branch of my wife’s family with her cousin Terry Lasky includes some lines where we do not know if the ancestors are brother, half-brothers or first cousins. We have descendants of two ancestors who DNA tested that we can compare. Those who are 3 generations down would be 3rd cousins if the ancestors are brothers, half 3rd cousins if they are half-brothers, and 4th cousins if the ancestors are 1st cousins.
All of our family includes endogamy. Terry and I have been worried about the effect of endogamy on our cM shared values, and on the effect that the Ancestry Timber algorithm would have on our cM values.
Terry has 32 DNA testers from this branch who tested at Ancestry. Among the testers he had 138 pairs of them where he knew for sure how they were related and did not know of a second way they might be related, other than through endogamy.
Parent/child are 1 generation apart. At Ancestry DNA, parent/child pairs match with 3476 cM. Children are two generations apart (up to parent, down to other child). Their average match at Ancestry DNA should be 3/4 of a parent/child match or 2607 cM. An uncle/aunt/nephew/niece is 3 generations apart, and an average match at Ancestry DNA in theory should average half of a parent/child match and be 1738 cM. From there on, every extra generation halves the cM matching. What we are doing is counting meiosis which is the number of times the cells recombine. Meiosis 6 for example can be 2nd cousins, 1st cousins twice removed, half 1st cousins once removed, or great-great-great-great grandparent/child and many other relationships. But they all should have the same theoretical average cM at Ancestry DNA and that should be 217 cM.
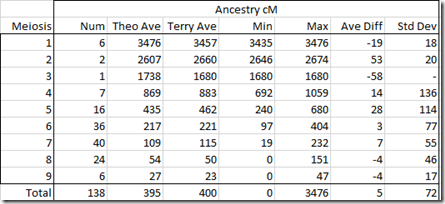
So what I did is averaged Terry’s known pairs by meiosis and compared them to what the theoretical average cM should be at Ancestry. It resulted in this table:
This very much surprised me when I first saw it. I had thought that Terry’s Ancestry numbers would be considerably higher than the theoretical averages due to endogamy. But Terry’s pairs averaged only 5 cM higher than the theoretical values. That is extremely close.
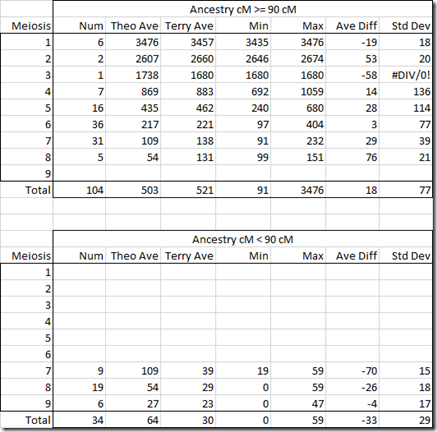
I scratched my head wondering why. These are the post-Timber values which had some segments removed by TImber. I decided to separate out the Timber affected numbers from those unaffected and divided the above table into >= 90 cM and < 90 cM.
Again I was surprised. The meiosis 7 and 8 have average differences of +29 and +76 for >= 90 cM. They have average differences of -70 and -26 for < 90 cM.
It seems Ancestry optimized their 90 cM cutoff for Timber to get the averages in the meiosis levels to be close to the theoretical. What this seems to show is that it is not a good idea to separate out the two or to try to correct for their Timber algorithm. Their numbers with Timber seem to be best.
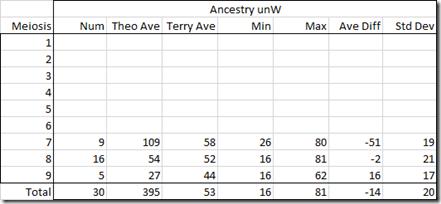
Just to check, I averaged out the Ancestry unweighted values for Terry’s pairs:
Meiosis 8 corrected is okay, but meiosis 7 has and average difference of -51. Compare that to an average difference of 7 in the original raw values with Timber. So I wouldn’t want to use these unweighted. Using Ancestry’s values with Timber seems best.
It seems that the Ancestry genetic scientists knew what they were doing with Timber. They seemed to have optimized it so that each meiosis level will average out very close to it’s theoretical value.
Blaine’s Shared cM Version 4.0
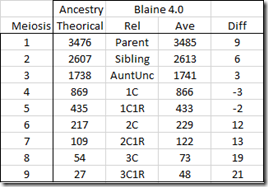
Well that was really good to know. Now I wanted to know how much Blaine Bettinger’s Shared cM Project v4 varied from the Ancestry theoretical averages. Surely Blaine’s would be different. His numbers were based on submissions of people who got cM values not just from Ancestry, but also from 23andMe, Family Tree DNA, GEDmatch, MyHeritage and others. Not all companies report exactly the same way. Family Tree DNA includes small segments down to 1 cM and will usually report higher shared cMs for the same two people.
So here was a second surprise:
Blaine’s values are actually very close to the Ancestry theoretical value for the closer relationships. Even meiosis 6 to 9 isn’t that far away. I attribute the slightly larger differences for the more distant relationships being due to some reported pairs being related an additional way that is adding to the amount. It isn’t much, just 12 to 21 cM,
None-the-less, Blaine’s numbers match up well with the Ancestry theoretical and that’s good to know.
Conclusion
Ancestry did Timber for a reason. It seems to me that they may have calibrated TImber so that the average cM for a given relationship would be the same as the theoretical average. Even if they didn’t do that calibration on purpose, it sure worked out well.
My recommendation is to use the Timber-based numbers, especially when comparing to Blaine’s shared cM project.
Don’t worry about the new unweighted Shared DNA values, and stop complaining so much about Timber.

