In my last post, New Version of WGS Extract, I used WGS_Extract to create 4 extracts from 3 BAM (Binary Sequence Alignment Map) files from my 2 WGS (Whole Genome Sequencing) tests.
These extracts each contain about 2 million SNPs that are tested by the five major consumer DNA testing companies: Ancestry DNA, 23andMe, Family Tree DNA, MyHeritage DNA and Living DNA.
Almost two years ago, I posted: Comparing Raw DNA from 5 DNA Testing Companies to see how different the values were. Last year, in Determining VCF Accuracy, I estimated Type I and Type II error rates from two VCF (Variant Call Format) files that I got from my WGS (Whole Genome Sequencing) test.
But in those articles, I was not able to estimate how accurate each of the tests were. To do so, you need to know what the correct values are, in order to be able to benchmark the tests. But now with my 4 WGS extracts and my 5 company results, I now have enough information to make an attempt at this.
For this accuracy estimation, I’m going to look at just the autosomal SNPs, those from chromosome 1 to 22. I’ll exclude the X, Y and mt chromosomes because they each have their own properties that make them quite different from the autosomes.
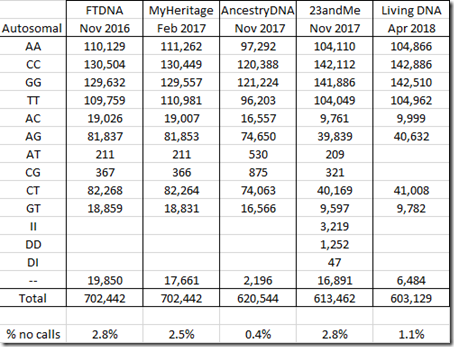
Let me first summarize what I’ve got. Here are the counts of my autosomal allele values from each of my standard DNA tests. I’m not including test version numbers, because different places list them differently, so instead I’m including when I tested:
Comparing the above table to the one from my Comparing Raw DNA article last year, all values are the same except the 23andMe column. Last year’s article totalled 613,899 instead of 613,462, a difference of 437. I’m not sure why there’s this difference, but I do know this new value is correct. Whatever mistake I might have made should not have significantly affected my earlier analysis.
I find it odd that 23andMe and Living DNA both have half as many AC and AG values as the other companies. I also find it odd that Ancestry DNA has twice as many of the AT and CG values as the other companies, and that Living DNA has no AT or CG values. I have no explanation for this.
23andMe is the only company that identified and included any insertions and deletions (INDELs), the II, DD and DI values, that it found.
The double dash “–" values are called “no calls”. Those are positions tested that the company algorithm could not determine a value for. The percentage of no calls range from a low of 0.4% in my Ancestry DNA data to a high of 2.8% in my FTDNA data. Matching algorithms tend to treat no calls as a match to any value.
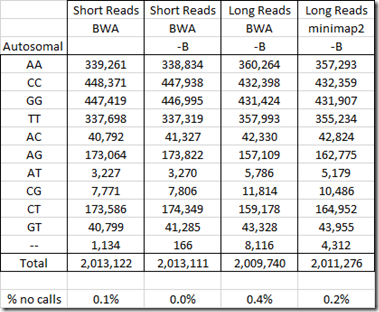
Below are the counts from my WGS tests:
I have done two WGS tests at Dante Labs: a Short Reads test and a Long Reads test.
For the Short Reads test, Dante used the program BWA (Burrows-Wheeler Aligner) to create a Build 37 BAM file. I then used WGS Extract to extract all the SNPs it could.
For my Long Reads test, I used the program BWA to create a Build 37 BAM file. (See: Aligning My Genome). But BWA was not supposed to be good for Long Reads WGS, so I had YSeq use the program minimap2 to create a build 37 BAM file.
The WGS Extract program would not work on my Long Reads file until I added the –B parameter to the mpileup program. The –B parameter is to disable BAQ (Base Alignment Quality) computation to reduce the false SNPs caused by misalignment. Because I had to add –B to get the Long Reads to work, I also did a run with –B added to my Short Reads so that I could see the effect of the –B parameter on the accuracy.
When I used WGS Extract a year ago (see: Creating a Raw Data File from a WGS BAM file), it produced a file for me with 959,368 SNPs from my Short Reads WGS file and I was able to use it to improve my combined raw data file.
Accuracy Determination
Now I’ll use the above two sets of data to determine accuracy. By accuracy, I’m interested in knowing if a test is saying that a particular position has a specific value, e.g. CT, then what is the probability that the CT reading is correct?
I will ignore all no calls in this analysis. If a test says it doesn’t know, so it isn’t wrong. Having no-calls is preferable to having incorrect values.
I will also ignore the 4518 SNPs where 23andMe say there is an insertion or deletion (II or DD or DI). The reason is because few of the other standard tests have values on those SNPs (which is good) but almost all the WGS test results do have a value there (which is conflicting information and bad!). Somehow WGS Extract needs to find a way to identify the INDELs so that it doesn’t incorrectly report them as seemingly valid SNPs. Of course some of 23andMe’s reported INDELs might be wrong, but I don’t have multiple sources reporting the INDELs to be able to tell for sure. I do have my VCF INDEL file from my Short Reads WGS, but then it’s just one word against another. A quick comparison showed that some 23andMe reported INDELs are in my VCF INDEL file, but some are not.
So first I’ll determine the accuracy of the standard DNA tests, then of the WGS tests.
The Accuracy of Standard Microarray DNA Tests
I have 4 BAM files from 2 WGS tests using different alignment or extraction methods. There are 1,851,128 out of the over 2 million autosomal positions where all 4 WGS readings were all the same and were not no calls and the 23andMe value was not an insertion or deletion.
Since all 4 BAM files agree, let’s assume the agreed upon values are correct.
I compared these with the values from each of my 5 standard tests:
That’s not bad. An error rate of 0.5% or less. Fewer than 1 error in 197 values. FTDNA and MyHeritage’s tests were the best with an error rate of about 1 out of 600 values.
These tests are all known as microarray tests. They do not test every position, but only test certain positions. They are very different from WGS and are expected to have a lower error rate than WGS tests. Of course, they often include 3% no calls to their results, but that’s the tradeoff required to help them minimize their Type I false positive errors.
The Accuracy of Whole Genome Sequencing Tests
WGS tests have several factors involved in their accuracy. One is the accuracy of their individual reads which in the case of Long Read WGS is said to be much worse than Short Read WGS, maybe even as bad as 1 in 20. But those inaccurate reads are offset by excellent alignment algorithms that have been tuned to handle high error rates. This is a necessary requirement anyway because the algorithms need to handle insertions and deletions as well.
Another factor in accuracy is coverage rate, and 30x is considered to be what will give reasonably accurate results. If you have 30 segments mapped over a SNP, and 13 of them say “A” and 16 of them say “T” and 1 says “C”, then the value is likely “AT”. If 27 are “A” and 3 are “T” then the value is likely “AA”. They’ve been doing this for a long time and know the probabilities and they’ve got this down to a science (pun intended).
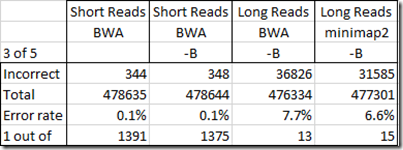
So my question is what is the accuracy of my WGS Extract SNPs from my four BAM files. To determine this, I’ll do the opposite of what I did before. I’m going to find all the SNPs where at least 3 of my standard DNA tests gave the same value and the others either gave a no call or did not test that SNP. From my above analysis, each of my standard tests should have at least a 1 in 200 error rate, so three or more different tests with all the same value should not be wrong very often. I’ll compare them with every position in my 4 BAM files that have a value and are not a no call. Here’s my results:
So my Short Reads test gave really good results. Only 1 in over 1300 disagreed with my standard tests. That’s quite acceptable. The –B option on creating the BAM seemed to have little effect on the accuracy.
But those Long Reads tests – ooohh! I’m very disappointed. 7.7% of the values in my Long Reads BAM file created with BWA were different from my standard tests. Using minimap2 instead of BWA only reduced that to 6.6%. This is not acceptable for SNP analysis purposes. The penalty for getting the wrong health interpretation of a SNP can be disasterous.
I’m very disappointed in this Long Reads result. Even though Long Reads are known to have higher error rates in individual readings, I would have thought that the longer reads along with good alignment algorithms that take into account possible errors, would give good values once you have a 30x coverage. If 1 out of 10 values are read wrong, then 27 out of 30 values should be correct.
So something else is happening here. This high error rate can come from one of several places. It could be read errors, transcription errors, algorithm errors, problems in any of the programs in the pipelines to create the BAM files, or problems in the programs that WGS Extract uses, such as the mpileup program.
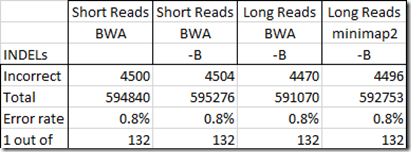
So then can the Short Reads test values still be used? Well, I still have one outstanding problem with them. That’s with regards to INDELs as reported in my 23andMe test. Unfortunately, the results out of WGS Extract gives SNP values at almost all of the INDEL positions. In the table below, I compare only the INDEL positions out of all the 23andMe positions that match each test:
Now I’m still not sure if the 23andMe value is correct or if the long read value is correct, but reporting a SNP value where there is an INDEL could be happening as much as 0.8% of the time, at least in the values reported by WGS Extract. This is something that needs to be looked at by the WGS Extract people to see if they can prevent this.
Conclusions
For genealogical purposes and relative matching on the various sites including GEDmatch, the standard microarray-based DNA tests are good enough.
Don’t ever expect that your DNA raw data is perfect. There are going to be incorrect values in it. Most matching algorithms for genealogists allow for an error every 100 SNPs or so. Some even introduce new errors with imputation. As long as errors are kept to under 1 in 100 or so, differences in analysis for genealogical purposes should be small. But because of these inaccuracies, nothing is exact.
It is worthwhile if you upload to a site, to improve the quality of your data by using a combined file made up of all the agreeing values from your DNA tests. See my post on The Benefits of Combining Your Raw DNA Data.
WGS tests are worthwhile for medical purposes, but are probably overkill for genealogy. The WGS files you need to work with are huge requiring a powerful computer with large amounts of free disk space. Downloading your data takes days and uploading your data to an analysis site is impossible on most home internet services. The programs to analyze these files are made for geneticists and are designed for the Unix platform.
There are not many programs designed for genealogists that analyze WGS data. The program WGS Extract is excellent, but you will need to know what you are doing. Until they find a way to filter out the INDELs, you’ll have to be careful in using the raw data files that the program produces.
Followup Nov 20, 2021: I found that a raw data file download from a company can change over time, and I posted an article: Your DNA Raw Data May Have Changed. I now think this is the reason for the discrepancy I mention above in my 23andMe counts.


